When in-person events moved online during the pandemic, the volume of data available to organizers probably jumped tenfold, estimates Joe Colangelo, founder and CEO of Arlington, Virginia–based events analytics company Bear Analytics. Where should planners start and how do they effectively communicate what the data means for their digital, hybrid, and in-person events?
“When you talk about being able to tell your data story, it starts with the collection” of what you want to put on your storyboard, Colangelo said. Perhaps the richest place to go mining for data is around your event’s content.

Joe Colangelo
“There’s a slew of information or data you want to be collecting around content,” he said.
“And content has the most dimensionality — when it takes place, and that can infer things. Is it the first day? Is it the last day? Is it before lunch? Is it after lunch? Who the speaker is, how the speaker’s rated. Is it a panel? A half-hour session versus an hour session? That’s the logistics aspect to the content. And then there’s all the behaviors — do people stay? When do they check in? When do they check out? Do they consume two pieces of content together? Do they tend to go to sessions along the same track?”
Some of the features of online event platforms — Bear Analytics has demoed hundreds of platforms and created a database of more than 400 to identify common features leading to data — “are massively powerful, just massively powerful,” Colangelo said. “Being able to have people learn, share, and collaborate together — there’s been a ton of innovation in the last two years.”
Online platforms gave “dimensions to the data that we just didn’t have a line of sight to” pre-pandemic, he added. “We never really had feedback tables because the only live feedback that people had was post-event surveys. But now, if we were in a session together and you were speaking, I can give you a smiley face, I can give you a net promoter score” within the app or during the online experience, he said. “I can say, ‘Here’s what I liked,’ and you’re getting more of the population to fill it out than a survey six weeks later where you’re trying to get someone to remember something.”
Michelle Russell is editor in chief at Convene.

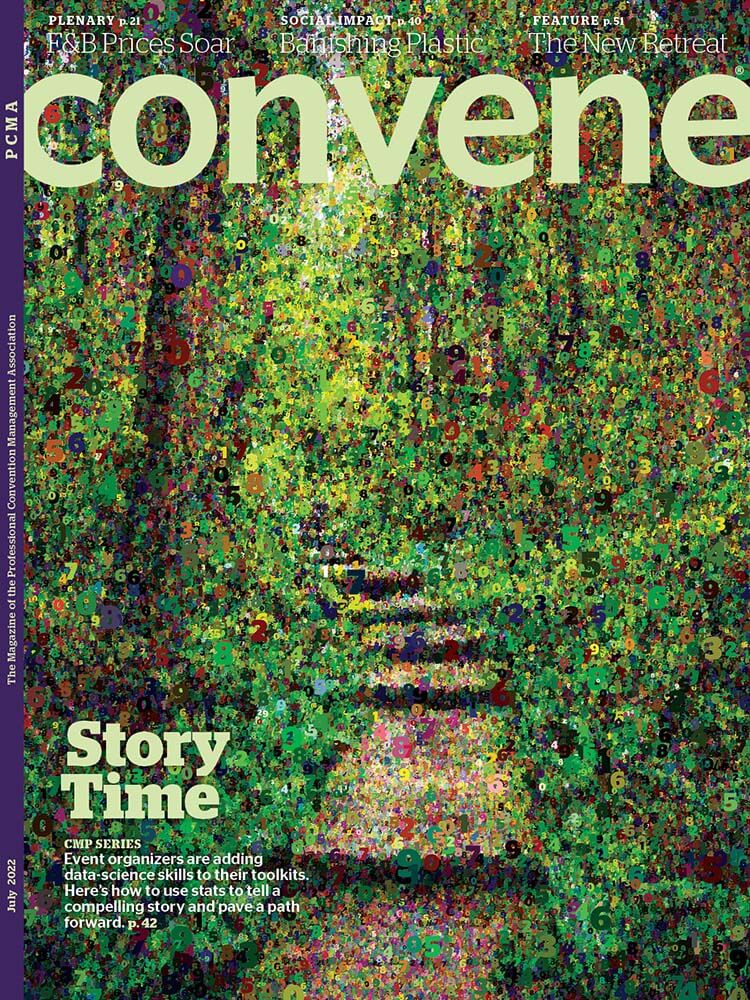
Convene July 2022 Cover & CMP Series Package
Following are links to other articles from the July cover story:
- Using Event Data to Chart a Path Forward
- Event Data: Translating Numbers Into Concrete Ideas
- Making Emotions Count in Your Event Data
- 3 Steps to Impactful Data Storytelling
RELATED CONTENT
- Nancy Duarte’s “3 Ways to Help People Understand What Your Data Means” in the Harvard Business Review
- A five-minute HBR video, “Telling Stories with Data in 3 Steps”

