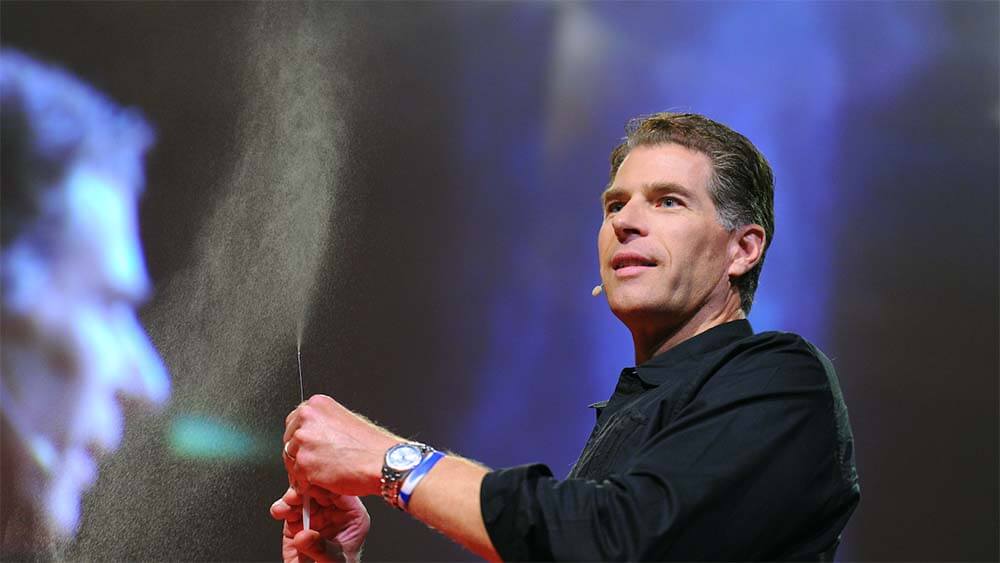
Neuroscience researcher Paul Zak founded a company called Immersion, which can measure how well a speaker or experience has kept the audience’s attention, among other things.
There are two kinds of data: quantitative data, meaning things that can be counted, and qualitative data, which is based on interpretation and usually related to language. The events industry traditionally has relied on qualitative tools, like surveys and focus groups, for information about how engaged audiences are with experiences.
There’s a problem with that, says Paul Zak, a neuroscience researcher and professor at Claremont Graduate University in Southern California, who was among the first academics to study the impact of oxytocin on empathy and relationships. The things that cause people to be immersed in an experience are rooted both in emotion and attention, and people can’t accurately report on their unconscious emotional experiences, Zak said.
For the last two decades, Zak and his colleagues have been developing another way to measure the effect of oxytocin and dopamine on human behavior, through physiological markers like changes in neurochemicals and the interaction with things like heart rate. For many years, the work was constrained by the fact that it requires the use of lab equipment that costs hundreds of thousands of dollars. But “I’m really a tool guy,” Zak told Convene. “I like to create tools to solve problems.” And to create an accessible tool that could measure “this neurological state of immersion, which is attention and emotional resonance,” Zak said, “we basically took these multiple neurologic signals and combined them into a single signal” — one that can be measured with wearable devices like smartwatches.
Zak founded a company called Immersion, which has clients in industries including entertainment and corporate training. But it’s a natural for the events industry, too, Zak said. (Maritz Global Events was an early adopter.) The technology can be used at many levels, including measuring how well a speaker or experience has kept the audience’s attention on average, or can be used before and after events to measure anticipation and information retention, he said. Individuals can also opt in to get feedback on their own response to different experiences, Zak said.
Some of his corporate clients who spend as much as a billion dollars a year on training their employees previously relied exclusively on post-event surveys to gauge their effectiveness, Zak said, asking questions like: How was lunch? How did you like the keynote? “But what they really want to know is: Did the information stick in your brain? And that’s what Immersion measures.”
One way clients are using the technology is by testing their keynotes with Immersion — a practice that is yielding quantitative data that affirms the power of storytelling, Zak said. “What they are finding is that a narrative arc is a really effective way to keep people immersed,” Zak said. “A human-scaled story with real emotions, and with a conflict, works really, really, really well, as opposed to PowerPoint.”
Barbara Palmer is deputy editor of Convene.

Convene July 2022 Cover & CMP Series Package
Following are links to other articles from the July cover story:
- Using Event Data to Chart a Path Forward
- Event Data: Translating Numbers Into Concrete Ideas
- Where to Start on Your Event Data Journey
- 3 Steps to Impactful Data Storytelling
RELATED CONTENT
- Nancy Duarte’s “3 Ways to Help People Understand What Your Data Means” in the Harvard Business Review
- A five-minute HBR video, “Telling Stories with Data in 3 Steps”
